R Package Shiny Template
How to use this template
This template contains two files to help you get started with building your own reports/apps against the AFL Sports Data API using R and Shiny. The two files included (and available to download here) are:
app.R
This file contains the app's server & user interface. It is commented throughout with snippets detailing the functionality provided by each component of the app.
backend.R
This file contains:
- Components of the app that only need to be run once upon launch (e.g. loading in packages)
- Variables that only need to be initialised once (API credentials, metric list & payload, fixture reference data etc.).
Getting Started
You can use this template to build own live apps/reports off the back of the AFL API. Use this article to begin building reports fit for your particular needs.
With this template app, you can get a feel for the workflow of:
- Selecting a match
- Pulling in a series of desired metrics for that match (preDefinedMetrics variable in backend.R)
- Displaying those metrics in tables, in a desired format
- Polling the API again at a desired cadence (refreshSeconds variable) to repeat steps 2 & 3 above
Add Credentials
Begin by adding your api credentials to the api_un & api_pw variables in backend.R to allow the app to connect to the AFL API.
Change the Pre-Defined Metrics
Customise the metrics contained in preDefinedMetrics and see them flow through to the tables. The matches pre-loaded into the fixture dataframe in backend.R are the matches available in both Production & Sandbox (match replay) environments.
You can run the app against the live matches by changing the environmentVar variable to “sandbox” in backend.R when the matches are replaying live. For more details on the matches available and sandbox replay schedules, see: Sandbox Environment
There are a number of elements in this template that were chosen arbitrarily, such as shinyWidgets() for the type of dropdown inputs, or reactable() tables to display the data. These are not necessarily better or worse than any other framework, and you should consider your own requirements or preferences for such elements.
Recommendations
Modular app/folder structure
What: Split out the elements of your app/report into smaller, more defined files as opposed to one large, single file.
Why: Cleaner and more readable code, easier for debugging when trying to fix issues, makes adding in additional modules/functionality to the report more straightforward.
Example: Within this template is an app.R file which is the main driver of the report and contains both the UI and server, but you may find it useful to split those out into a ui.R and server.R separately depending on big they are. There is also a backend.R file for elements to be loaded only once upon the app launching, but you might also have other files that are contained in your app folder that have specific purposes. An example folder structure for an app below:
- ui.R
- server.R
- backend.R
- functions.R (general bespoke functions you may have defined for a specific purpose)
- plots.R (functions or logic to create plots in your report)
- data_processing.R (functions or logic to transform the data from the API into a desired format for your report)
Efficiently polling the API for latest data
What: Pulling in data from the Champion Data API during a live match in an effective manner.
Why: Reduce/remove inefficiencies within the app, have an understandable and maintainable flow for how data comes in and is displayed.
Example: There are multiple ways to achieve this, however the method for doing this in the template provided is contained entirely within the observe() call under the ‘Variables’ heading in the server. This method involves keeping the part of the app that does the refreshing all in the one centralised location, with the reactiveVal() objects (match_data & match_stats) being updated with the latest data and flowing through to the rest of the report from there. In brief, the workflow is as follows:
- [After the user selects a match via the inputs] Hit getMatch() function for the status of the given match
- If the match is live (or about to start) hit the API for the desired stats and schedule a timer to re-hit the API in X-number of seconds (the number of seconds is defined by the refreshSeconds variable in backend.R)
- Update the reactiveVal()’s with the latest data, when this happens the tables using this data to display are refreshed app-wide.
This process being contained in a centralised location within the observe() call allows for an easily understandable and straightforward workflow, as well as making it easily modifiable to meet the needs of your report.
Refresh Frequency
The cadence at which this template refreshes is governed by the refreshSeconds variable in backend.R. As a general rule be wary of setting this number too low, causing it to refresh too frequently. The invalidateLater() function used is time-based, not "finish-based" - it will attempt to re-run the given code block regardless of whether the previous execution of that code block has completed or not. So if your app is unable to compute and render all the elements of your app before the next refresh is scheduled, this can lead to poor performance or even crashing.
Also be mindful of your account's usage limit, particularly if you have multiple instances of your app running under the same account.
Reactive Safety
You will notice at different points throughout the app.R code that blocks of code have reactive values or inputs wrapped in the req() function to ensure these blocks have valid values (not NULL, NA) for these inputs before being run.
Example:
# Ensure matchId() reactive exists before running this block
req(matchId())
A suggestion here to use these where possible in your own apps as to avoid any downstream errors or issues within your reports.
Performance
Code frameworks
What: Choosing the most efficient and appropriate code framework(s) for different functionality within the app.
Why: Reduce latency & bottlenecks, improve performance.
Example: Choosing the most efficient code frameworks (baseR, dplyr, data.table etc.) or specific functions is something to be aware of and can help streamline parts of your app. Take the following example:
Code:

Result:

As the results from this microbenchmark show, using dplyr for this snippet of code to extract the match.id for the match chosen by the user is on average ~25x slower than using baseR to achieve the same thing. This is a negligible example, but something to be aware of throughout your app.
In terms of specific functions, the same applies: some are better than others to achieve the same result. Below is the output from comparing the reading in of a (large, 6.5m rows) static .csv file using readr::read_csv() and data.table::fread(), with fread() being approximately ~4x faster on average.

POST Endpoint
What: Using the POST endpoint functions to pull Squad & Player stats as opposed to the GET endpoint equivalents.
Why: POST endpoints are faster & unlock the ability to pull in far more data while still only using a single call to the API, beneficial for usage limits.
Example: Not only is going via the GET versions of the Player & Squad stats functions - getSquadStats() , getPlayerStats() - more lines of code and more calls to the API than the POST functions - getSquadStatsPOST() , getPlayerStatsPOST() – its also ~3x slower to pull the same data in the below example:
Code:
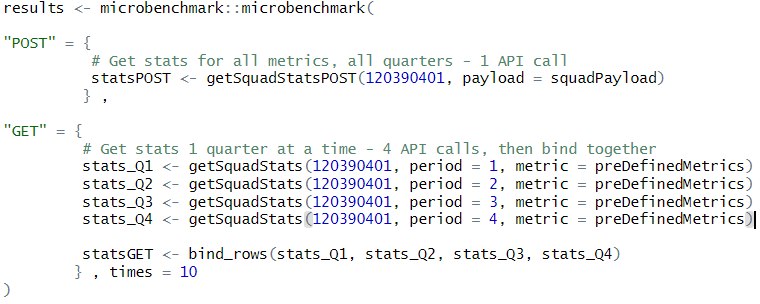
Result:

Therefore, it is recommended any calls to retrieve Player & Squad stats are done exclusively via the POST endpoint(s).
Benchmarking, Profiling & other optimisations
There are a number of other processes that can be undertaken to fine tune the performance of your apps/reports such as benchmarking & profiling. We wont be elaborating on any of these exclusively, but a great resource to learn more can be found at: [Mastering Shiny - Performance (23)] (https://mastering-shiny.org/performance.html).